7.1 - Social cohesion
Renewed growth "can bring back full employment and is the foundation of social justice and opportunity for all". This was pointed out by the European Commission when relaunching the Lisbon strategy. However, this objective is unreachable as long as large strata of society do not have access to jobs, education and other opportunities. In order to provide for truly sustainable development, sheltered from the threats of social disruption and disparity, it is vital to concentrate efforts on the reduction of inequalities and marginalisation through integrated actions which promote social cohesion. This is both a moral commitment and a prerequisite for a more competitive and dynamic society. Economic growth and social cohesion are viewed as mutually reinforcing concepts, as only countries with a cohesive and responsive social fabric may live up to the rapidly changing global challenges.
The principles of equal treatment and non-discrimination have already been laid down in the Treaty Establishing the European Union and in the EU Charter of Fundamental Rights. To underline once more the importance of a more equal society which provides equal opportunities, the European Union has designated 2007 as the European Year of Equal Opportunities for All. It aims at eradicating stereotypes and discrimination based on sex, race, ethnic origin, religion, political or other opinion, disability, age or sexual orientation. On the one hand, it aims at raising citizens' awareness and fuelling the debate on the advantages of a society based on justice and solidarity. On the other hand, it should trigger and strengthen positive actions on the part of social partners and political decision-makers which stress the value and the potential of diversity as a source of socio-economic vitality. Eradicating discrimination and embracing diversity means to protect socially disadvantaged groups, making sure that all persons are given the same opportunities to make a positive and tangible contribution to our societies.
Following the path towards social cohesion and therefore to better quality of life for all means reducing social inequalities and regional disparities, promoting participation in the labour market, promoting education and training through investments in human capital, safeguarding fundamental rights, and providing access to health care services and services in general.
 First and foremost: fighting poverty First and foremost: fighting poverty
Social equity as the foundation of lasting and sustainable development is built through the reduction of poverty. This knowledge has made the fight against poverty a priority issue in the Community's social policy and is, among others, highlighted in the Social Agenda 2005-2010 of the European Commission. 68 million European citizens at risk of poverty are far too many.
According to the definition of poverty adopted at a European level (Note 1) which refers to the income households dispose of, Italy is not only one of the European countries most at risk of poverty, but it shows also pronounced disparities in the distribution of income. The situation appears even more critical when compared to the EU15 only. The most recent data available are from 2004 and show that 19% (Note 2) of the population live in underprivileged households, meaning that they dispose of a net income below the poverty threshold set at 60 % of the equivalised national median income (Note 3). The poverty threshold varies from country to country and is determined by taking into consideration the income distribution among the population. For instance, the poverty threshold for Italy equals ca. 8,200 Euros for single households and 17,352 Euros for a couple with two children. In terms of buying power, this surely exceeds the values determined for the Eastern European countries, but not those of the EU15, except for Spain and Greece.
The situation in Europe as a whole is better. 16% of the European population is at risk of poverty, which is three percentage points below the Italian rate. The proportion is decisively lower in the Nordic countries, in the Czech Republic, in Austria and in Germany, with values between 9% and 12%. In addition it must be considered that their values refer to a national income threshold which is relatively higher than in the EU as a whole and in Italy. Apart from Italy, the percentages of Greece, Spain, Ireland and Portugal (all with a poverty incidence of 20%) and most importantly of Poland and Lithuania (21%) are also higher than the EU percentage (Note 4).
The EU member states make different use of the tools to contain poverty and support persons in financial need, i.e. of social transfers (disability and old-age pensions or other types of social transfers). For instance, the measures taken in the northern European countries (Sweden and Denmark) are particularly effective, leading to a reduction of the poverty rate by even more than 60%, while the average European reduction is of ca. 40%. In Italy, the effect is rather contained, reducing poverty by just 20% (after social transfers, the percentage of persons at risk goes down from 23.6% to 19%). Clearly this situation is not yet satisfying. The measures taken in the other Mediterranean countries prove to be even less effective.
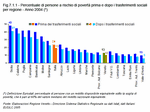
The phenomenon of poverty in Italy is highly area-dependent. The divide between the regions of the north and the south is considerable: in southern Italy, more than 30% of the population is at risk of poverty, in Sicily almost 41%, compared to 13% in central Italy and even less (10%) in the northern regions. Sardegna and particularly also Abruzzo stand out against the other southern Italian regions, the latter with a poverty rate (17.5%) clearly below the average of the regional breakdown and also below the overall Italian value. Among other reasons, this can be put down to the more significant poverty-reducing effect of social transfers. Most effective are the income support schemes in Friuli-Venezia Giulia, where the number of poor people has reduced by 32%, and in particular also in Valle D'Aosta. There, the at-risk-of-poverty rate is already limited in the first place, and social transfers cut it further down to 5.9% of the population. This is the lowest percentage of the nation. In the Veneto, poverty is rather contained. The poverty rate after social transfers is of 10.3% (Note 5), corresponding to sixth place in the regional ranking and affecting 481,000 persons (Figure 7.1.1).
 The most vulnerable groups: children, youths, the elderly and women The most vulnerable groups: children, youths, the elderly and women
The following analysis of the poverty rates according to social groups refers to national figures, as there are currently no estimates available for the regions. The general picture of Italy still gives interesting insights into the population strata which emerge as those most disadvantaged and vulnerable.
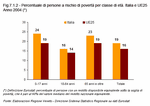
The breakdown of the population into age cohorts shows Italy's poverty rate consistently above European values. The divergence from the Community average is especially strong (five percentage points instead of three) for children and young persons under 18 years of age. They are most exposed to poverty (24% in Italy, one of the highest percentages in Europe) due to the ever greater difficulties households with small children face. This holds true in particular for lone parents whose income is generally lower. In fact, 50% of Italian households consisting of one parent with at least one dependent child under 18 live on less than 1,500 Euros a month. The average net income of households of this type amounts to 1,670 Euros monthly, compared to ca. 2,850 Euros per month for households with two parents. This gap is even wider in the southern Italian regions and amounts to 1,650 Euros per month on average. While the disposable income for single parents is not much higher in the north than in Italy as a whole (on the average only 4% more per month), two-adult households in the north have a monthly net income of almost 3,400 Euros (+16%) (Figure 7.1.2).
Even though the situation is most alarming among under 18s, young adults aged 18-34 seem not to be that much safer either, particularly those under 30 years of age. Some time ago, this population group was not considered at any particular risk. The phenomenon is rather recent but expanding, mainly due to the changes that have occurred in the labour market, in education and training careers and in the transition from youth to adulthood. The risk of poverty is higher among the lesser educated. However, even higher level education degrees no longer provide reliable protection against poverty for Italy's younger generation. Young persons with a higher secondary education diploma or university degree are more at risk of poverty than those with this level of education in the general population. Furthermore, young singles may be less at risk than other lone persons, in particular lone elderly people; however, young couples with children turn out to be more strongly disadvantaged, especially if only one parent is gainfully employed. This confirms that starting a family often coincides with an already precarious period which becomes even more dangerous if there is no supportive family network to rely on.
Elderly persons are also facing serious difficulties, with 23% of them at risk of poverty in Italy. Most affected are those of the older age cohorts and those who live alone. The average Italian living alone and aged 65 plus lives on little more than 1,000 Euros a month. The income of those living in the north is only slightly higher while the residents of the central Italian regions are a little better off. The income is lower for those who live in the south, receiving on the average ca. 140 Euros less per month than elderly persons in central Italy. Furthermore, 50% of all elderly people live on less than 900 Euros monthly.
Today, women are still living in more precarious and economically disadvantaged conditions which might develop into situations of true social exclusion. The new forms of poverty affect women in particular and even more so women in situations of increased vulnerability: female immigrants, female heads of household with low incomes, women with lower levels of education and elderly women.
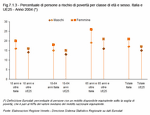
At both European and national levels, women are exposed to a higher risk of poverty than men. However, the female rate is clearly higher in Italy (21%) than in Europe (17% for the EU25). Also the gap between women and men is, at four percentage points, twice as big as in Europe. The situation of elderly women among the most exposed population groups is particularly alarming: in Italy, 26% of all women over 65 years of age are at risk of poverty, seven percentage points more than men (Figure 7.1.3)
In more general terms, there is a strong disparity in the distribution of income between the sexes. Net income from self-employment in Italy in 2003, for which gender-specific data are also available for the regions, was lower for women than for men by 27% on average. The difference in income is generally bigger in the regions of Italy's north than in the south. In line with this, the divide is bigger in the Veneto, where women earn 31% less than men. Contrary to the situation at a national level, the difference is greater for income as an employee, again amounting to 31%, than from self-employment, where the gap is of 26% to the disadvantage of women. On the other hand, only 11.7% of women in the Veneto are self-employed as opposed to 26.1% of men.
As regards income from pensions, whether that be old-age pensions or assistance benefits (i.e. invalidity, disability or other pensions), the divide is slightly smaller and amounts to 29%, in line with the national value. Due to the greater longevity of women, the number of retired women is higher than that of men. In 2003, the Veneto counted more than 640,000 retired women, ca. 33,000 more than men.
 Income disparity Income disparity
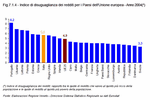
The gap between rich and poor is rather wide in Italy. In 2004, the percentage of income received by the richest 20% of the population was 5.6 times higher than the resources the poorest 20% of the population had at their disposal. The average Community value is of 4.9 (EU25 data). More equity is found in Sweden (3.3), Denmark and Finland, followed by Austria, France and Germany (Figure 7.1.4).
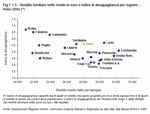
Eight Italian regions have a less balanced income distribution than Europe. Some of them are in the south and are regions whose average income level is lower than in Italy as a whole. Three are located in the north and include Lazio and Lombardia, two of the country's wealthiest regions. In general it is the regions of the south which show higher levels of inequality and are the main cause of the large gap between rich and poor opening up in Italy.
The overall situation in the Veneto is better as its households dispose of an average income higher than at a national level. Most importantly, there is a more equal distribution of the resources leading to a smaller income gap between rich and poor. The richest 20% of the population have an income percentage 4.2 times higher than the one of the poorest 20% of the population. Together with the figures of Friuli-Venezia Giulia and Toscana (with a ratio of 4.2 and 4.1, respectively), this represents the most equal income distribution in Italy (Figure 7.1.5).
There are disparities, therefore, both within regions, as well as between regions, as is seen in the marked north-south divide in the distribution of income. An Italian household earns an average annual income of ca. 28,100 Euros, while in the regions in the south, except for the more favourably positioned Sardegna and Abruzzo, the annual income varies between the ca. 21,000 Euros in Sicily as the lowest value and the almost 24,000 Euros in Campania. Lombardia registers the highest average income (ca. 32,300 Euros per year), followed by Emilia-Romagna. The Veneto ranks eighth in the regional standings of Italy's richest regions. Here, households dispose of an average annual net income of ca. 29,300 Euros, corresponding to ca. 2,450 Euros monthly. This amount is 100 Euros above the average disposable monthly income of an Italian household. However, 50% live on less than 2,000 Euros a month.
 Signs of economic deprivation Signs of economic deprivation
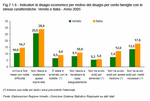
Besides the most serious cases, a number of Italian households live in conditions of economic deprivation. In 2005, 14.7% of Italian families said that they struggled to make ends meet at the end of the month and find it hard to even satisfy their basic needs, let alone finding the money for unplanned expenses. This generally problematic situation takes various shapes in an everyday situation: in the course of the year, 5.8% of households did not have enough money to buy foodstuff on at least one occasion, 17.8% to purchase necessary clothing, and 12% to cover medical treatment. Difficulties arise further when it comes to pay gas, electricity and phone bills in due time (9% of the households), pay off the debts for furniture or other goods paid by instalments (14.4%) or pay the monthly rent or loan instalments (3.8% of households). To contain costs, some households cannot afford adequate heating of their dwelling either (10.9%). These difficulties may also be only temporary, however, it is often the case that the different forms of deprivation occur jointly. Furthermore, the fact that the percentages of deprived households, also when broken down into the above-listed types of deprivation, have hardly changed in the past two years indicates the lasting nature of the phenomenon (Figure 7.1.6).
Households in the Veneto in general experience less financial problems and a lower degree of deprivation due to the higher income available. In particular, difficulties in paying for medical treatment and buying necessary clothes are less frequent than at a national level. One in ten households say that they find it hard to make ends meet, while one in four, which is still below the national average, considers it impossible to make a necessary but unplanned 600-Euro investment. More positive still is the general situation in Trentino-Alto Adige, Lombardia, Emilia-Romagna, Friuli-Venezia Giulia and Toscana. However, the above data are derived from the subjective perception of one's own living conditions which may depend not only on the level of disposable income but also on other factors such as the fact of having a job, the type of employment and financial security it provides, degree of education, state of health and, more generally still, individual expectations.
 Youth inclusion through education Youth inclusion through education
Italy has made efforts to lower its poverty rate to bring it in line with the average European level by 2010. Most importantly, efforts are being made to counteract child poverty in response to the prompt of the European Council made in 2006 and repeated in 2007 to "rapidly and significantly reduce child poverty, giving all children equal opportunities, regardless of their social background". This has been made a priority of the European policy of social cohesion, as in several member states, including Italy, children are more exposed to the risk of poverty than the rest of the population. The majority of EU countries have embarked on an integrated long-term approach to fight child poverty and marginalisation. The approach consists of coordinated measures to prevent passing on poverty from one generation to the next and most importantly to prevent various forms of deprivation among children and young people. The measures aim to grant every child the opportunity to grow up in a healthy and balanced manner, because deprived children are more likely to fail at school, get into legal troubles, develop diseases and stay excluded from the labour market and society.
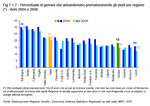
Among all possible strategies, it seems wise to focus on early school-dropouts. The problem is symptomatic of a complex situation of deprivation and difficulty in adapting and favours the phenomena of marginalisation, exclusion and social deviance, particularly if it occurs in combination with other problems of a socio-economic and cultural nature. Within the European Union, the school dropout rate is measured as the percentage of young persons aged 18-24 who leave school without obtaining an upper-secondary school diploma and do not take part in any other education or training activity. Despite some progress, the situation in Italy remains critical. In 2006, ca. 21 out of 100 youths aged 18 to 24 had a lower-secondary school diploma only and did not participate in any (re-)training programmes. Only Spain (29.9%), Portugal (39.2%) and Malta (41.6%) show higher percentages still. The gap between Italy and the European average (15% for the EU25) and the values of Germany, France or England (all having rates around 13-14%) remains significant. Furthermore, Italy is still 11 percentage points off the target average of 10% set by the European Union for 2010.
No Italian region has currently a dropout rate below 10%. Lazio shows the best result with a rate of 12.3%. The dropout phenomenon is more pronounced in Italy's south but is for quite different reasons also affecting the regions of the north. There, early leaving is mainly due to better job opportunities also with lower levels of qualification which make longer education and training cycles seem less fruitful. In the Veneto, the phenomenon is rather limited, and the countermeasures taken seem more effective. In fact, it has caught up with other regions in the past years. In 2006, the dropout rate amounted to 15%, compared to 18.2% two years earlier. Now, the Veneto ranks fourth in the regional standing (Figure 7.1.7).
Moreover, the number of dropouts aged 15 has been reduced considerably. In the school year 2004-2005, only six out of 100 youths enrolled in the first year of the Veneto's upper secondary schools dropped out, a fall of almost half compared with two years previously, earning the Veneto second place in the regional ranking. From this follows an increase in young people's participation in education and of the number of youths who obtain at least a diploma from upper secondary schools. This held true in 2006 for 82% of all young persons aged 20 to 24, more than at a national level (75%).
 Improving basic skills Improving basic skills
Future job opportunities and income prospects largely depend on the quality of education. Therefore, it is necessary to raise the quality of education received and the level of basic skills acquired. The PISA survey (Programme for International Student Assessment) (Note 6), initiated and carried out by the OECD in 41 countries in 2003, allows us to measure to what extent pupils nearing the end of compulsory education have acquired skills considered essential for full participation in society and the ability to continue learning throughout life. Three areas are subject to evaluation: mathematics, reading and problem-solving, i.e. the ability to draw on knowledge and skills to solve real-life and cross-curricular problems. The results of the students are located along scales of competence which are divided into levels of performance: six levels for mathematics, five for reading and four for problem-solving.
Schools in the Veneto achieved satisfying results in 2003 even when compared internationally. First and foremost the percentage of students with few skills in all three subjects is lower while the share of students with a medium-high level of ability is higher than the Italian average and roughly in line with the international average. Moreover, 12% of the 15-year-olds of the Veneto reach the highest scores in mathematics, 8.2% do so in reading and 16.7% in problem-solving. Compared to the other regions surveyed, the skills Veneto's students have acquired turn out to be higher than those of the pupils in Toscana and Piemonte, but lower compared to Lombardia. However, young people in Trentino-Alto Adige are of a clearly higher level, excelling also on an international level. (Figure 7.1.8).
However, compared to the other OECD countries, the general performance of Italy's students leans towards the lower levels, as only a minor proportion of students is able to solve the most difficult tasks. Only 7 out of 100 Italian pupils reach the highest level on the mathematics scale of competence (versus 15% for the OECD), 5 out of 100 the highest level in reading (versus 8% for the OECD) and 11 out of 100 in problem-solving (versus 18% for the OECD). The educational achievement of Italy's students is the worst in the entire European Union except for Greece. Similar yet slightly better results than in Italy were obtained in Portugal and Spain. The internationally best performances were achieved in Korea and Finland in all three subjects and in China in particular as regards the mathematical and problem-solving skills. Also Japan excelled in the latter subject.
 Employment - the best way to fight social exclusion Employment - the best way to fight social exclusion
Gainful employment offers the most effective protection from poverty and social exclusion for men and women. However, the fact that one out of ten gainfully employed persons is at risk of poverty in Italy shows that a job alone may not be enough. It appears to be of crucial importance to fight chronic situations of financial precariousness, in particular for young persons, so that employment can provide a secure way out of poverty. Employment must therefore be made an opportunity for all, without discrimination on the labour market. Access to the labour market must be promoted for the most vulnerable groups, i.e. for the young, elderly, women, disabled persons, legal immigrants and minorities, and regional disparities must be reduced. For more details on the developments in labour market and current employment rates for the various population strata see the chapter "Human capital for growth in Europe":
The reinstatement of unemployed and non-active persons into the labour market is fundamental. Most importantly, it must be targeted also at the long-term unemployed who are more vulnerable and exposed to the risk of poverty. Their reintegration is more difficult, as the rapid changes of the labour market can easily render their skills obsolete.
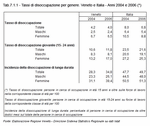
In the Veneto, 4% of persons on the labour market were unemployed in 2006. The age cohort of 15 to 24-year-olds is most affected. For them, the risk of not being able to enter the job market for the first time or keep their employment is almost three times as high as for the total of the population. Women are in general more disadvantaged than men, in particular young women. Their unemployment rate amounts to 17%, compared to 8.1% for young men of the same age group, despite the higher female average level of education. The situation has even deteriorated over the past few years, as two years earlier only 13 out of 100 girls were seeking a job. The unemployment rate of young men, on the contrary, has remained more or less stable over the past few years. Moreover, roughly 35% of all unemployed persons in the Veneto stay unemployed even after one year of active job-hunting. The time it takes to find a job has become longer over the years, and the incidence of long-term unemployment has increased by 6 percentage points in the course of just two years. In 2000, it amounted to merely 16%. Women are most hit by this development, as 40% of all unemployed females have been out of job for more than twelve months. Moreover, the gap between women and men keeps widening.
The problem of unemployment covers all groups, i.e. the young, women and men, less severe in the Veneto than in Italy as whole. However, the gender gap is more pronounced, especially as regards young persons and the long-term unemployed, which can mainly be attributed to the higher male employment levels in the Veneto region (Table 7.1.1).
 Redundancy and reintegration Redundancy and reintegration
The loss of employment and the often resulting difficulties of reintegration into the labour market entail a high risk of poverty and social marginalisation. In the following, some data relating to persons who have involuntarily lost their jobs due to company closure, downsizing of staff or other objectively justified reasons will be analysed. Such cases of redundancies need not necessarily be a consequence of business hardship but may also be caused by business migration.
According to the data of employment centres, such job terminations have shown a substantial growth in the Veneto over the years. In 2005 the number had doubled compared to 1998. In the course of these eight years, ca. 150,000 persons were affected. Women were predominantly affected until 2003, and then the distribution levelled out. Women, however, are in general younger than men. Considering the 45,244 workers who lost their employment in 2003 and 2004, 61.4% of the women were between 20 and 40 years old compared to 55.1% of men. As opposed to this, the age cohorts close to retirement age, i.e. age 55 plus, made up 5% of women and 7.8% of the men who were made redundant.
What are the employment prospects of this share of the workforce? Considering the situation in 2005 we can see that ca. 60% of persons who had lost their jobs from 1998 onwards found employment in the course of 2005, with a peak value of 64% for those who were made redundant in 2004. Furthermore, 64% of men and 62% of women who had lost their jobs in the two-year period of 2003-2004 were back in employment. The higher age of male workers and the resulting better social protection measures make transition from the cessation of a job to retirement easier. In fact, while there is an equal distribution between unemployed and retired persons among all non-employed men, 26% of women were unemployed in 2005 and only 12% were registered as retired from the labour market (Table 7.1.2).
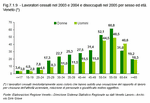
Reintegration after unemployment proves more difficult for women than for men. This holds true for almost all age cohorts. For women at peak working age, reintegration into the labour market is much more difficult than for men. The proportion of unemployed women is almost twice as high as that of men of the same age group (Figure 7.1.9).
The percentage of foreign workers losing jobs has increased over the years, going from 4.2% in 1998 to 20.2% in 2005. However, in the years under evaluation, the absolute number of foreign workers has also grown considerably (around 200%), partially as a consequence of the regularisation of foreigners. The percentage of foreign employees made redundant in 2003 and 2004 but back in employment in 2005 is higher than that of Italian workers (66% versus 63%). This can be attributed to the male share of foreigners in employment of 69%, compared to the female share of 61%. The better reinsertion figures of the foreign workforce reflect their younger age. In fact, 76.6% of foreign workers made redundant were under 40 years of age, as opposed to 57.4% of Italians, implying a smaller share of foreign workers moving towards retirement.
 Back Back
Notes
- The same definition is also used in the national report on strategies for social protection and social inclusion issued by the Italian Ministry of Labour and Social Security, the Ministry of Social Solidarity and the Health Ministry in September 2006 ('Rapporto nazionale sulle strategie per la protezione sociale e l'inclusione sociale').
- These Eurostat data refer to the survey of households 'EU-SILC - European Statistics on Income and Living Conditions'. As opposed to previous years, this report uses the definition of poverty adopted by Eurostat, based on household disposable income, to better compare Italy's situation with the other EU countries, instead of the definition adopted by Istat in Italy which measures poverty relative to the monthly consumption expenditure and allows for no international comparison. The Istat survey on consumption shows lower estimates of poverty. According to Istat, 13.2% of Italy's population was at risk of poverty in 2004.
- To allow for the comparison of households of different size and composition, the household income is divided according to a set of parameters of a so-called equivalence scale to obtain the equivalised income. In this case, the equivalence scale used is the one recommended by the OECD.
- The analysis refers to a measurement of relative poverty. Poverty is not defined with respect to an absolute standard or one value for all countries but is evaluated relative to a certain threshold. This threshold varies from country to country because it is set taking into consideration each country's income distribution. Therefore, the actual living conditions defining poverty are not the same in all countries.
- According to the Istat definition of relative poverty based on the monthly consumption expenditure, 5% of the Veneto's population was considered at risk of poverty in 2004.
- PISA is an international survey conducted every three years. In 2003, 42 countries took part, among them all 30 OECD members. The survey evaluates the skills and abilities of students near the end of compulsory education (in almost all OECD countries, the age of 15 precedes or coincides with the end of compulsory schooling). It is a sample survey. Italy's sample is made up of 407 schools and a total of 11,000 pupils which represent a population of ca. 500,000 15-year-old enrolled students.
|
| Figure 7.1.1 |
 |
| Figure 7.1.2 |
 |
| Figure 7.1.3 |
 |
| Figure 7.1.4 |
 |
| Figure 7.1.5 |
 |
| Figure 7.1.6 |
 |
| Figure 7.1.7 |
 |
| Figure 7.1.8 |
 |
| Table 7.1.1 |
 |
| Table 7.1.2 |
 |
| Figure 7.1.9 |
 |
|


 Index
Index 


