6.4 - The environment in urban areas
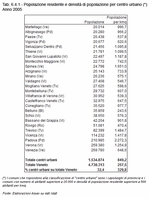
For some time now, the Veneto has been faced with urgent environmental problems which typically affect industrialised and urbanised areas. The problems are brought about by the growing demands on natural resources on the one hand and emissions of polluting substances into the environment on the other. These problems are of concern in most of the region's territories but affect the individual areas to a different extent. Here, the discussion of environmental issues will be limited to the main urban centres where the biggest share of the population lives and where the challenges are most urgent. The assessment of waste production will further include centres of high tourist intensity. Apart from the 7 provincial capitals, 19 urban centres were identified on the basis of two criteria: number of inhabitants above 20,000 and a residential density of over 500 inhabitants per km2 (Note 1) (Table 6.4.1).
 Availability of public green space Availability of public green space
Liveability in urban areas requires the designation of a certain share of the land as public green spaces. As sufficient data are not available for all urban centres, analysis will be limited to the provincial capitals.
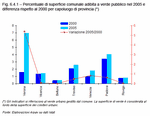
The city of Verona is in the lead as regards available public green spaces with 7% of the municipal surface area in 2005. This figure also reveals a major increase compared to 2000 when the same share amounted to 1% only. Venezia showed improvements too, but its share of public green surface area stayed below 2%. A slight improvement was registered for Padova which ranks second among the provincial capitals, with 4% of the municipal surface area designated as public green space in 2005, and for Treviso (2.6%). The values for Vicenza, Rovigo and Belluno, however, remained more or less unchanged. Belluno stands out as the capital with the lowest percentage of public green space (0.5%). Considering the special morphology of the area, this can probably be put down to the lower need for public green space as there is plenty of private green space available (Figure 6.4.1).
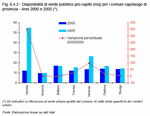
The per-capita amount of public green space exceeded in 2005 the standard value of 9 m2/inh. laid down in the Ministerial decree DM 1444/68 and in the regional law LR 61/85. However, it must be taken into consideration that this standard refers to equipped green spaces only while the data provided in this report also include non-equipped spaces.
Verona again stands out with its 54.9 m2 per inhabitant in 2005. It is not only the Veneto's leading provincial capital but also ranks fourth among all provincial capitals at a national level. Venezia could improve its position and ranks now 2nd in the Veneto with 26.5 m2/inh. Belluno may have a low availability in terms of public green surface area, but it provides its population with 16.8 m2/inh., which is more than Padova, Treviso, Rovigo and Vicenza (Figure 6.4.2).
 Municipal waste production Municipal waste production
The 2005 data show that all provincial capitals apart from Belluno which ranks 21st are among the first 9 of the 26 urban centres which were assessed for their per-capita municipal waste production. In Venezia, Rovigo and Padova, the value of the indicator even surpasses significantly the national average of 539 kg per inhabitant and year.
Venezia is also the provincial capital where waste is least separated. This results from the particular structure of the city and from the noticeable impact of tourist presence which leads to more non-separated waste. Paese is the most active municipality when it comes to separating waste and has a lower per-capita rate of overall waste production.
At a regional level, the waste produced per capita equalled 482 kg/inh./year in 2005. Roughly half of the municipalities under scrutiny remained under this value, with Paese and Valdagno as the leaders.
In quantitative terms, every inhabitant of the Veneto separated an average amount of 229 kg of waste in 2005. This is an increase of 24 kg compared to 2004 (Figure 6.4.3).
In about two thirds of the municipalities assessed, the average production of municipal waste per capita has grown from 2000 to 2005, often even considerably, while the remaining municipalities recorded a decline in waste generation. The value achieved by Paese differs considerably from all other values. Among all the municipalities under evaluation, Paese separates the most and produces the least waste. The decline in waste production can mainly be put down to the system of collection introduced in this municipality of the Treviso province. From 2001 to 2002, Paese more than doubled the percentage of separated waste collected, going from 34.9% to ca. 64%. This figure also continued to go up in the succeeding years and reached almost 70% in 2005. Switching over to a system of "door-to-door" collection has also brought about a noticeable reduction in dry residual waste and biodegradable waste produced by local industries, previously collected in waste banks (Figure 6.4.4).
 Separated waste collection Separated waste collection
In 2005, the Veneto separated a proportion of 47.5% of the waste produced which is almost twice as much as the national average of 24.3%. This means that the Veneto has already reached the objective of 45% which art. 205 of the legislative decree D.Lgs 152/06 set for the end of 2008. Italy, however, is still far off the threshold value of 35% set in the legislative decree D.Lgs. 22/97 and scheduled as the target value for 2003. The majority of the 26 main urban municipalities in the Veneto increased noticeably the amount of separately collected waste between 2000 and 2005. In the cases of Thiene and Paese this corresponded to an increase of the share of separated waste in total municipal waste produced by even more than 40 points, reaching a proportion of separated waste of 72.1% and 63.4%, respectively. Two municipalities only, Montecchio Maggiore and Valdagno, showed a slight reduction in the percentage of separate waste collection in the same time frame.
The threshold value of 35% was achieved in almost all municipalities analysed. The role models are Paese and Montebelluna which reached a percentage of separated waste close to the threshold of 70% in 2005. Of the provincial capitals, Verona, Belluno and Venezia are still below the 35% threshold value. This fact underpins the difficulties encountered in organising an efficient waste collection service in bigger urban centres.
Comparing the tendencies in waste production with the proportions of separated waste collected shows that in general those municipalities which have improved their performance regarding waste separation are the ones that have also managed to invert the upward trend in waste production. This gives clear evidence that the path of waste separation is the one that leads to a reduction of the impact of waste production on the environment (Figure 6.4.5).
Systems of municipal waste collection
The systems of collection of municipal waste are an important indicator of the municipalities' waste management.
The diffusion of a source-separated system of kerbside (door-to-door) collection of dry residual waste and biodegradable waste has noticeably improved the outcomes of separate waste collection everywhere in the Veneto. This system of waste management leads to a continuous reduction of the proportion of waste taken to landfill. Furthermore, the door-to-door waste collection system has raised citizens' awareness of the waste issue.
Based on the 2005 data, all 26 municipalities assessed distinguish between dry and biodegradable waste and collect the organic part separately from the rest of the waste.
The majority of municipalities apply one and the same system for both types, dry residual and biodegradable waste, i.e. either kerbside (door-to-door) collection or a bring (carry-in) system of roadside bins. Usually the same system is also used for paper, glass and plastic waste.
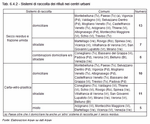
The Municipality of Padova is the only one using both systems, kerbside and bring, for the biodegradable as well as the dry waste, according to districts (town centre and periphery). Other hybrid systems are used in Conegliano (kerbside for dry and bring for biodegradable waste), Bassano del Grappa (kerbside for dry and kerbside/bring for biodegradable waste), Verona and Venezia (kerbside/bring for dry and kerbside for biodegradable waste), and Belluno (kerbside/bring for dry and bring for biodegradable waste).
The collection systems for the dry recyclable waste (glass, paper, plastic) shows the most similarities: the bring system of roadside bins and banks is still the most widely used system in the assessed urban centres even though the kerbside system is the more successful one.
It can be observed that those municipalities who adopt the kerbside (door-to-door) collection system are those who register the higher percentages of separate collection and a lower total of waste produced (Table 6.4.2)
The pressure of tourism
Tourism is undoubtedly one of the Veneto's main economic resources. However, it also exerts certain pressures on the municipal environment which often also force small municipalities to face problems which are typical for large urban centres, such as the considerable production of waste, the higher traffic burden, resulting in noise and atmospheric pollution, and the increase in sewage to be treated, to name but a few. The fact that tourist presence is not evenly distributed over the year makes it even more difficult for the local administrations to optimise and implement solutions.
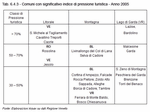
For 25 municipalities of the Veneto, the 2005 index used to measure tourism intensity (Note 2) equalled or exceeded 30% (Note 3). The same index yields extremely low values for the provincial capitals. This can be put down to their bigger size in terms of population, but also to the fact that it is impossible to integrate in this index day tourists for whom there are no data available (Table 6.4.3) and (Figure 6.4.6).
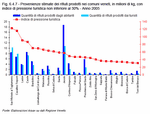
Estimates of the respective annual amounts of waste produced by residents and tourists were made for those municipalities with a tourist intensity index of over 30% and for the provincial capitals (Note 4). Jesolo turned out to have the highest annual amount of waste generated by tourists who spent at least one night in the town, but at the same time it has the highest population figures which also explains the high overall production of waste. The estimates of tourist-produced amounts of waste were also very high for San Michele al Tagliamento, Cavallino and Caorle. Among the provincial capitals Venezia stands out. Just as expected, it has the highest amount of waste caused by tourist presence (Figure 6.4.7)
 Noise-level zoning of the municipal territory Noise-level zoning of the municipal territory
The population in urban centres in particular perceives noise as one of today's primary environmental problems. According to Istat data, this held true in 2005 for 37.8% of Italian families. Noise pollution is also of major concern for 32.7% of the people in the Veneto.
Verona is the province with the highest percentage of municipalities which have adopted or at least approved a plan of noise-level classification of their respective territories (Note 5). The Rovigo province also shows a rather high percentage. The province of Padova is at the bottom of the list, as only 47% of the municipalities reacted to the relevant legal provision.
From the analysis of the major 26 municipalities in the Veneto it turns out that most of them have adopted a plan of noise-level classification of the territory. According to the data received before December 31, 2005, Bassano del Grappa, Mirano, Montecchio Maggiore, Paese, Thiene and Vicenza were the municipalities which had not yet embarked on this strategy (Figure 6.4.8).
 Energy consumption Energy consumption
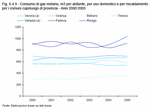
Information provided herein on the consumption of energy in urban areas is limited to the seven provincial capitals. Particular attention is paid to the consumption of methane gas in households and for heating purposes between 2000 and 2005. The tendency registered for Belluno stands out. Though growing consistently, the values are much lower than those of the other cities. This fact could be explained by the higher use of wood (and other fossil fuels) which is the main combustible used for household heating. Higher methane consumption is recorded for the municipalities of Rovigo and Padova, followed by Venezia and Vicenza with similar scenarios, and lastly by Verona and Treviso. The trend of the period from 2000 to 2005 does not reveal any important change. A slight growth in consumption is observed in the municipalities of Rovigo, Venezia and Belluno (Figure 6.4.9).
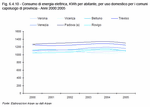
Another indicator used to assess the energy demand in the Veneto is the consumption of electricity for household purposes. In this case, too, the information on consumption is limited to the seven provincial capitals.
At the top of the ranking is Padova, followed by Treviso and Venezia and the other cities which all show more or less the same consumption levels.
The trend curves do not reveal a particular development in one direction but rather show a certain variability over time. For instance, all municipalities with high consumption values showed a decline in 2005, while those with lower consumption values registered an increase compared to 2004.
Assessing the 2000-2005 variation in consumption gives evidence of a slight growth for the municipalities of Venezia, Rovigo and Padova (Figure 6.4.10).
 Air quality Air quality
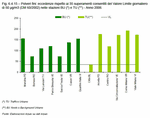
Urban centres are generally the region's hot-spots of atmospheric pollution due to the usually higher concentration of emission sources such as traffic, heating, industrial facilities etc. From the total of 25 monitoring stations (Note 6) which are located in the seven provincial capitals, at least one Urban Background (UB) station and one Urban Traffic (UT) station was chosen per capital. UB stations give median pollution values which are representative of the municipality being monitored and not predominantly influenced by urban traffic, while UT stations give maximum pollution values which are representative of the municipality and influenced mainly by traffic from nearby roads or streets.
Nitrogen dioxide
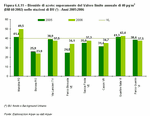
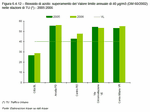
The annual average limit value of 40 µg/m3, which is the concentration threshold (Note 7) for nitrogen dioxide becoming effective, as laid down in the applicable regulations, in 2010, was exceeded in the course of 2004 and 2005 only at the stations of medium criticality (UB) of Padova and Vicenza and at all stations in high-pollution zones (UT) with the exception of the station Belluno-Città.
As regards the maximum levels registered on an hourly basis, the alert threshold of 400 µg/m3 measured over three consecutive hours was never exceeded in the same time frame. The hourly limit value for the protection of human health of 200 µg/m3, which is not to be exceeded more than 18 times in the course of one legal year and which will become legally effective in 2010, was exceed only 8 times in the course of both years under examination, twice at stations in medium-level pollution zones and six times at stations in zones of high traffic intensity (Figure 6.4.11) and (Figure 6.4.12).
Sulphur dioxide and carbon monoxide
In 2005 and 2006, the legal limit values this report refers to were exceeded a few times for these two pollutants. For sulphur dioxide (SO2), the reference values used were the alert threshold (500 µg/m3 measured over three consecutive hours), the hourly limit value for the protection of human health (350 µg/m3, not to be exceeded more than 24 times in one legal year) and the limit value for 24 hours (daily average) for the protection of human health (125 µg/m3, not to be exceeded more than 3 times in one legal year). For carbon monoxide (CO), the reference used for this report was the limit value for the protection of human health (10 mg/m3), calculated as the maximum daily 8-hour moving average.
Ozone
As ozone is not directly linked to traffic emissions, this pollutant is measured at Background stations only (except for the station Belluno-Città). In 2005 and 2006, the information threshold (180 µg/m3 on an hourly basis) and the long-term objective for the protection of human health (120 µg/m3, calculated as the maximum daily 8-hour moving average) were exceeded fairly often. The alert threshold (240 µg/m3 on an hourly basis) was also exceeded a few times, if only by little, at the two UB stations of Borsea in Rovigo and Sacca Fisola in Venezia (Table 6.4.4).
Particulate matter PM10
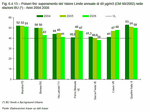
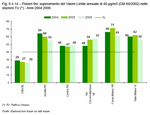
In the three years of 2004-2005-2006, the annual average limit value of 40 µg/m3 as well as the daily average limit value (exceedance of the 50 µg/m3-threshold is allowed 35 times per year) for particulate matter PM10, both defined by the Ministerial decree DM 60/2002, were generally not complied with.
Such scenarios are observed in all provincial capitals of the Veneto region at both UB and UT stations, apart from the station Belluno-Città. The PM10 situation in the Venetian plain and in the entire macro-region of the padan-adriatic basin in general seems to depend not only on the territorial distribution of pollutant sources but to a considerable extent also on the frequently occurring periods of atmospheric stagnation, a situation less frequent in mountain areas.
As regards the threshold of 35 annual exceedances of the daily limit value of 50 µg/m3, no such critical situation as in the provincial capitals located in the plain was registered in the town of Belluno in 2006 (Figure 6.4.13), (Figure 6.4.14) and (Figure 6.4.15).
Benzo[a]pyrene, benzene and lead
The benzo[a]pyrene content in particulate matter PM10 exceeded in 2005 the annual average target value (1 ng/m3, laid down in the Ministerial decree DM 25/11/94) in Padova, Venezia-Mestre and Vicenza while values remained below this threshold in Treviso and Belluno.
For benzene (C6H6), lead (Pb) and metals for which the Directive 2004/107/EC sets out average annual target values, no exceedances of the legal thresholds were measured at the monitoring stations considered in this report.
The most important reference value for benzene is the limit value for the protection of human health (5 µg/m3, effective from 2010) and for Pb the annual average limit value for the protection of human health (0,5 µg/m3), both defined in the Ministerial decree DM 60/2002.
For nickel (Ni), arsenic (As) and cadmium (Cd) reference is made to the annual average target values of 20 ng/m3, 6 ng/m3 and 5 ng/m3, respectively, of the above-mentioned Directive. It is to be noted that the metals Pb, Ni, As, and Cd are also contained in particulate matter PM10. (Figure 6.4.16).
 Back Back
Notes
- The most relevant topics are described using some environmental indicators which are applied, where possible, to the 26 selected urban centres or at least to the 7 provincial capitals. The calculation of the indicators is based on 2005 data except for a few cases where updates for 2006 were available.
- The indicator used herein to judge the additional pressure exerted on a town by tourist presence is the intensity of tourism in terms of the ratio of the average daily number of tourists present to the number of inhabitants of the municipal area.
The average daily number of tourists present is obtained by the number of nights spent by tourists in the municipality's accommodation establishments divided by 365. Only municipalities with more than two accommodation establishments were included in the calculations.
- Same-day visitors are excluded, as they do not spend the night in an accommodation establishment.
- It is possible to obtain an approximate estimate of the fractions of waste produced by locals and tourists by combining the data on nights spent in the city with the data on the annual waste production. The estimates are obtained by multiplying the ratio of the annually produced amount of waste to the average daily number of all persons present in the municipal area by the number of residents and the number of tourists present, respectively.
- The decision of the Veneto regional council DRGV 4313 of September 21, 1993, implementing the national provisions on noise pollution of the framework legislation Legge Quadro 447/95 and of the Prime Ministerial decree DPCM 14/11/1997, requires municipalities to adopt a plan of noise-level classification. The municipal territory must be classified into 6 homogeneous classes. For each class, limit values of acceptable ambient noise are set for day and night time. Herein, all municipalities which had adopted or approved a classification plan before December 31, 2005, are considered 'zoned municipalities'.
- The regional environmental agency ARPAV is in charge of the air-quality monitoring network in the regional territory of the Veneto which counted 57 stations in March 2007. 11 of these are located in the Verona province, 13 in the Vicenza province, 3 in the Belluno province, 6 in the Treviso province, 14 in the Venezia province, 5 in the Padova province and 5 in the Rovigo province. Pursuant to the new technical provisions, the stations of the network are classified according to the quality and quantity of emission sources which characterise the ambient air of the site (Traffic, Background or Industrial) as well as type (Urban, Suburban or Rural) and characteristics (Residential, Commercial, Industrial, Agricultural, Natural, or Combinations of these) of the zone they are located in.
- In this report, various types of threshold values of concentration are used for the different pollutants according to the following legal regulations:
Ministerial decree DM 02/04/2002 n. 60 lays down limit values, alert thresholds, margins of tolerance, times, criteria, measurement techniques and localisation of sampling points for sulphur dioxide (SO2), nitrogen dioxide (NO2), nitrogen oxides (NOx), carbon monoxide (CO), particulate matter (PM10), lead (Pb) and benzene (C6H6) in accordance with the legislative decree D.Lgs. 04/08/1999 n. 351.
The legislative decree D.Lgs. 21/05/2004 n. 183 sets information and alert thresholds, long-term objectives and target values for the protection of ecosystems and human health from the ozone (O3).
The Directive 2004/107/EC defines annual target values for arsenic (As), cadmium (Cd), nickel (Ni) and polycyclic aromatic hydrocarbons in ambient air. No target value is set for mercury (Hg), however, some guidelines are provided.
|
| Table 6.4.1 |
 |
| Figure 6.4.1 |
 |
| Figure 6.4.2 |
 |
| Figure 6.4.3 |
 |
| Figure 6.4.4 |
 |
| Figure 6.4.5 |
 |
| Table 6.4.2 |
 |
| Table 6.4.3 |
 |
| Figure 6.4.6 |
 |
| Figure 6.4.7 |
 |
| Figure 6.4.8 |
 |
| Figure 6.4.9 |
 |
| Figure 6.4.10 |
 |
| Figure 6.4.11 |
 |
| Figure 6.4.12 |
 |
| Table 6.4.4 |
 |
| Figure 6.4.13 |
 |
| Figure 6.4.14 |
 |
| Figure 6.4.15 |
 |
| Figure 6.4.16 |
![Benzo[a]pyrene: exceedance of the quality objective (DM 25/11/94) at UB (*) and UT (**) stations - Year 2005 Benzo[a]pyrene: exceedance of the quality objective (DM 25/11/94) at UB (*) and UT (**) stations - Year 2005](mini/f6_4_16.gif) |
|


 Index
Index 


![Benzo[a]pyrene: exceedance of the quality objective (DM 25/11/94) at UB (*) and UT (**) stations - Year 2005 Benzo[a]pyrene: exceedance of the quality objective (DM 25/11/94) at UB (*) and UT (**) stations - Year 2005](mini/f6_4_16.gif)