Business cycle
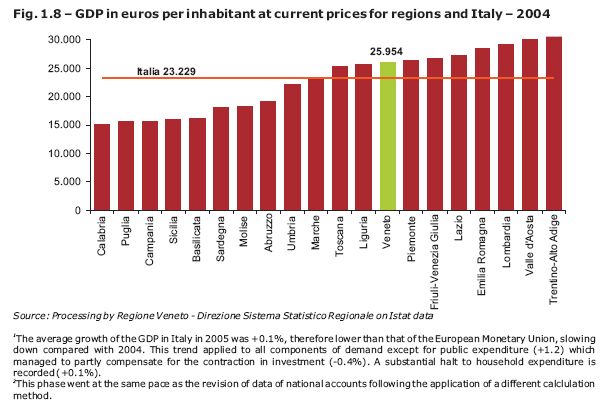
From the latest available data regarding territorial accounts for 2004, the Veneto confirmed itself as one of the top regions for the Italian economy, contributing with a 9.1% share to the national GDP. In annual terms, the GDP of the Veneto increased by 1.4% in 2004; +0.5 per cent compared with the national average and +0.1 compared with Lombardia. The GDP per capita of the Veneto grew by +2.7 per cent at current prices, up from 25,266 euro in 2003 to 25,954 euro in 2004, ranking 8th among regional GDPs per capita. The sectors which contributed most to the growth of value added at constant prices in Veneto (+1.6%) are, in order of importance, the service sector (+1.4%), within which the results of the trade, hotels, restaurants and transport divisions stand out (+2.4%), the public and social services sector (+2%), and construction (+3.1%). The performance of the agricultural sector was excellent (+14.2%), while in the manufacturing industry there was a modest rise (+0.4%).
In 2005 for the Veneto, as well as for Italy (Note 1), real growth in GDP was estimated at close to zero (+0,1%). The dynamics remained positive, albeit only slightly, thanks to the essential contribution of household spending (+1%), government spending and that of private social institutions (+0.9%). Gross fixed investment, as on a national level, decreased (-1.9%).
As regards the dynamism of sectors, only the value added of services is increasing (+1.2%), while all other sectors are witnessing a decrease of wealth produced. The value added generated by the agriculture sector lost nearly 5 percentage points, the industry sector in a narrow sense lost 1.1%, and even the value added of construction, after several very positive years, did not change (–0.6%). A rise in the region’s GDP is predicted (+1.4%) for 2006, stimulated mainly by a growth in investments.
Drawing indications from the recent slump of the Italian economy is certainly no easy task (Note 2), but beyond the short-term, a more moderate growth in expenditure can generally be seen, in line with what other European countries are witnessing. It is worth considering that precautionary saving is on the increase, in some countries as a consequence of the high unemployment rate, in others due to news of welfare reforms (whether carried out or not), and in other countries due to the fast aging of the population and uncertainties regarding the perspective self-sufficiency that this entails. In Italy the faster aging of the population in comparison with other European countries and labour market reforms led to a phase of near stagnation of production, but this did not interrupt the systematic reduction of the unemployment rate. There is, however, a general tendency for irregular productivity in the industry sector: for all divisions, apart from energy, 2005 was a year of decline compared with 2004.
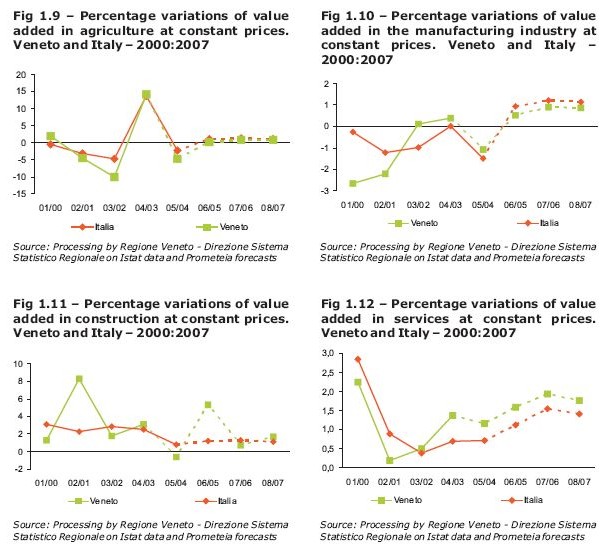
This slump in industrial production involved all the main categories of products in the manufacturing sector, and was concentrated above all in consumer and capital goods. Italy’s traditional products (clothing, textiles, shoes), were the most strongly affected, but production in some more technological sectors, such as vehicles, also decreased. However, despite the fluctuating industrial cycle, it seems we have overcome the most difficult period; indeed there are positive indications deriving both from the confidence of industrial companies which have been growing since the beginning of 2005, and from initial results regarding the index of industrial production estimated by Istat, which increased by +3.8% in the first two months of 2006 in comparison with the same period in 2005.
A gradual recovery of the Italian economy is thus forecast for 2006: growth of the GDP (around +1%) will be supported mainly by components of internal demand, with a 1.9% increase in investments, above all in the most innovative component of machinery and vehicles (+2.5%), and household spending (around +1%). In exports, the prediction of a further strengthening of the euro against the dollar should partly limit the progress of sales abroad.
A gradual recovery of the Italian economy is thus forecast for 2006: growth of the GDP (around +1%) will be supported mainly by components of internal demand, with a 1.9% increase in investments, above all in the most innovative component of machinery and vehicles (+2.5%), and household spending (around +1%). In exports, the prediction of a further strengthening of the euro against the dollar should partly limit the progress of sales abroad.
An analysis of the estimates regarding domestic consumption in 2004 shows an increase of expenditure in the Veneto (+1.2%) which is above the national average.
Household spending in the Veneto therefore grew, above all in durable goods (+7%). This is due not only to the increase of high-tech innovative products on the market, but also to the increased availability of financing for consumer credit. The services component also grew (+1.2%), while household spending on non-durable goods slightly declined (-0.8%).
For 2005 stability in consumer spending in comparison with the previous year is forecast for the Veneto, with a growth of about 1% both in family expenditure and public administration expenditure.
Consideration of what a family in the Veneto spends a month (Note 3) shows a trend which contrasts with the general situation of weak consumption, leading us to believe that some negative elements of the trend reported in recent years did not substantially affect the social and economic performance of the Veneto.
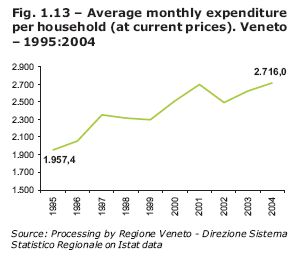
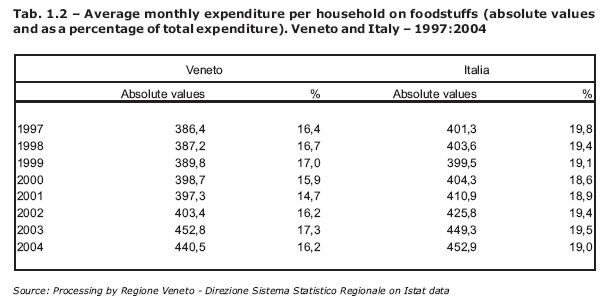
In 2004, average monthly expenditure for a family in the Veneto was 2,716 euro, 335 euro more than the national average, ranking the region third after Lombardia and Emilia Romagna, 96 euro up from the previous year.
The greater wealth enjoyed by households in the Veneto allowed them to allocate a greater share of income to non-food products, indeed expenditure on foodstuffs decreased by 3%, to 440 euro, though it continues to take up a considerable part of the household budget, 16.2% of total spending, but it is well below the national average (19%).
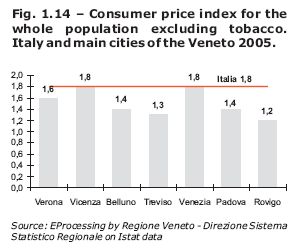
In 2005, despite the surge in energy prices, consumer price inflation in the euro area remained almost stable, up from 2.1% in 2004 to 2.2% in 2005. In Italy, the increase of the consumer price index for the whole population (CPI) turned out to be slightly lower than in 2004, down from 2.1% in 2004 to 1.8% in 2005.
As regards cities in the Veneto, in 2005 the growth rate of prices was highest (+1.8%) in Venice and Vicenza, with an annual increase in the price index of +0.1 per cent in Venice and +0.2 per cent in Vicenza. For all the other sample cities in the Veneto the price index was lower than the national average, decreasing in the last year by 0.3 per cent in Verona (from +1.9% in 2004 to +1.6% in 2005) and Padova (from +1.7% to +1.4%) and by 0.2 per cent in Belluno (from +1.6% to +1.4%).
As regards cities in the Veneto, in 2005 the growth rate of prices was highest (+1.8%) in Venice and Vicenza, with an annual increase in the price index of +0.1 per cent in Venice and +0.2 per cent in Vicenza. For all the other sample cities in the Veneto the price index was lower than the national average, decreasing in the last year by 0.3 per cent in Verona (from +1.9% in 2004 to +1.6% in 2005) and Padova (from +1.7% to +1.4%) and by 0.2 per cent in Belluno (from +1.6% to +1.4%).
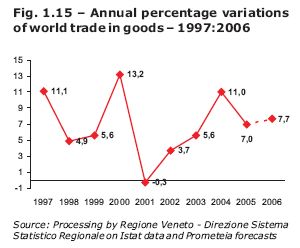
The Veneto does much of its business with foreign markets and consequently has felt the repercussions of a radically changing international economy governed by the laws of globalisation.
There was a relative slowdown in world trade flow, which increased by about 7% in comparison to 10% in 2004. The origin was a partial reduction in the rate of world economic development, in particular that of emerging Asian countries and the United States. After a pause in the middle two quarters of 2005, world trade showed signs of recovery towards the end of the year. A marginally more sustained increase is expected in 2006.
The trade flow of emerging countries has grown at about double the rate of industrialised countries since the beginning of the third millennium, and today the share of world trade held by emerging countries has risen to 40%. The increase in world trade is still steady, mainly due to the positive performance of the Asiatic region, which is fuelled by the extraordinary development underway in China and India, both of which saw their exports and imports rise by an average of 15 – 20% in 2005.
In 2005, the Veneto was particularly affected by a weakening in the link between world demand and EU and Italian demand, although the region retained a consistent share of national exports (13.4%).
Veneto exports dropped by –1.5%, after an excellent 2004 (+6.5%) (Note 4) in contrast with an increase of 4% at national level. These figures should be analysed more carefully because each year the official provisional data released in spring are adjusted upward some months later (Note 5).
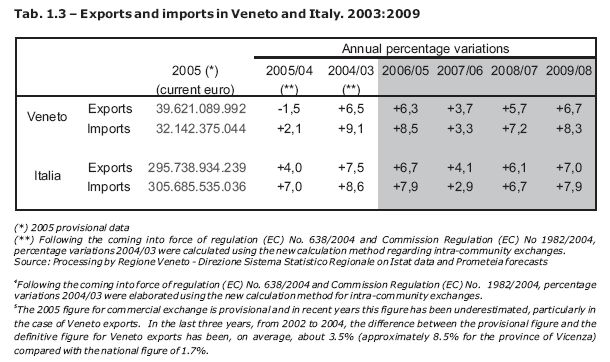
Despite a drop, the Veneto is still Italy’s second leading region in terms of overall exports (39.6 billion euro) and of exports per capita (8,482 euro).
Its imports were worth 32.1 billion euro, an increase of +2.1%, which produced an active trade balance of 7.5 billion euro.
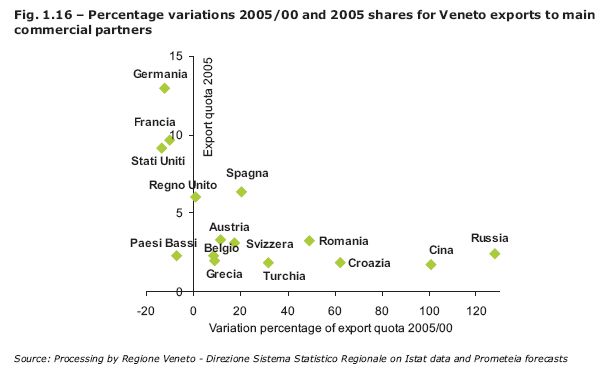
The EU is still the main channel of trade for Veneto products with a share of 56% of total exports, but there was an annual drop of 5.1%. The main increases were recorded in direct flows towards East Europe (+5.9%), the Middle East (+23.5%), North America (+1.5%), East Asia (+15%) and Central Asia (+12.5%).
The dynamics of the last two years highlights that the Veneto’s foreign trade is shifting towards the east. Exports towards China, Russia and Turkey, namely the countries driving world growth, have increased considerably. However, exports fell towards the Veneto’s traditional trading partners (Germany, the USA, France and the UK), a drop which has been partly offset by the growth within other markets such as Spain, Switzerland, Belgium and Croatia.
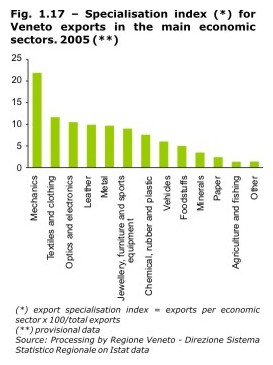
The metal and metal products industry has grown by 5%, a rise which also encompasses the increases in iron and steel prices; the machinery and mechanics industry also rose by 2.5%, confirming it as the region’s leading exporter (regional share 21.9%) and reflected an increase in the quality of exports, rather than an increase in the price of last year’s models; exports of electrical and electronic appliances also rose (+3.3%) as did those of chemical, rubber and plastic products (+2.1%). Of the Veneto’s major industries, its traditional ones recorded the sharpest drop, i.e. textiles (-5.2%), where the negative foreign balance of the fashion industry (-551 million euro) was almost identical to the total negative foreign balance of the Veneto (-586 million euro), a result due partly to the expiry of the Multifibre agreement; the leather industry lost 7% of its current value; the furniture industry recorded a drop in exports of 7.1%, the gold and jewellery industry also fell by 12.7%. Exports in the vehicle industry fell by 11.8%, which was partly due to a negative performance in the aircraft and aerospace vehicle industry in the province of Venice.
The 2.1% increase in Veneto imports is mainly due to a boom in goods from East Asia and, in particular, from China (+30.7%). In 2005, East Asia overtook East Europe (9.8%) to claim a share of 11.2% and become the second leading exporter of goods to the Veneto after the EU (59.4%). The value of imports rose from 2.9 billion euro in 2004 to 3.6 billion euro in 2005, an annual increase of 22.5%.
Italian exports are currently experiencing a period that is governed by two types of processes: the first type regards the production integration of the majority of European firms within the single market; the second regards the intensification of globalisation. Most affected are industrial processes that make labour intensive products, which face stiff competition in terms of cost and price, especially from emerging Asian countries.
These processes entail reallocation of production factors and in many cases some stages of the production process are delocalised. An additional problem is that of competitiveness, which often involves underlying issues such as innovation as well as the improvement of product quality and sales and after-sales services.
Frequently-used indicators are not always able to measure the dynamics of competitiveness accurately, especially at a time when processes and products are subject to rapid innovation and markets and structures are being overhauled. Export values often do not take into account a change in product quality; consequently an increase in value against the average value of a competitor may either mean an improvement in product quality with positive knock-on effects for competitiveness, or a drop in relative price, which will have negative effects.
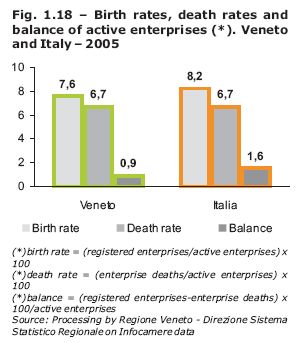
Business demography indicators in 2005 reveal a moment of reflection: the birth rate of enterprises was stable, 7.6% compared with the previous year, the death rate increased slightly, 6.7% compared with 6.5% in 2004. However the Veneto still ranks second for its number of active enterprises, 456,878, up +0.6% from 2004 and contributing 8.9% of the national total, preceded only by Lombardia (15.6%).
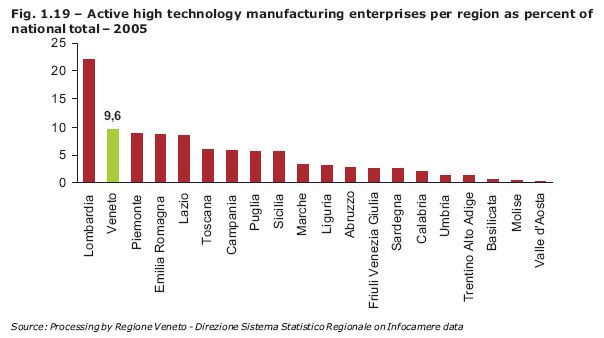
And in this case the effort to increase entrepreneurial competitiveness is noteworthy: In recent years there has been an increase both in specialised companies producing high technology goods and, consequently, in the supply on foreign markets. In 2005 the Veneto had 9.6% of the national total of specialised companies producing high technology goods, second only to Lombardia (22.2%).
A further indication of the technological quality of goods can be obtained by looking at the export dynamics of the manufacturing sector and aggregating sectors according to the standard OECD classification (2003) (Note 6). Since the end of the nineties the share of Veneto exports of high technology goods has been increasing. The share grew from 6.3% in 1998 to 8.3% in 2005, thus revealing a progressive increase in exports of products with very high added value and which are less affected by the competition from new emerging countries Though still dominant, the share of low technology exports declined, dropping from 44.7% in 1998 to 39.2% in 2005. The share of medium technology exports in this same period of time had limited growth: the share of medium high technology goods rose from 32.8% in 1998 to 34.4% in 2005, while the share of medium low technology goods rose from 16.3% in 1998 to 18.1% in 2005.
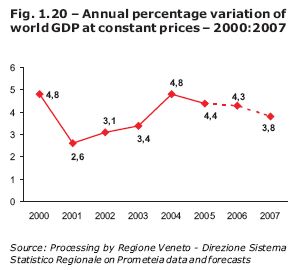
All this happened in the context of world economic growth, though slightly decelerating, as the figure for 2005 reveals, +4.4%. The first lustre of this millennium thus ended positively in terms of global growth.
These five years were decisive for the changes which have taken place in the economic world, above all for the rules and terms of trade, as well as for the shocks related to geopolitical tensions, the rise in petroleum prices, the exchange rate for the euro against the dollar, all factors which have led to moments of reflection and review of the models of development themselves.
The beginning of this twenty-first century is witness to the important role given to economic growth as an objective which links industrialized countries to developing countries despite their different circumstances: the former need growth to counter the financial consequences of their demographic contraction, while the latter pursue it in order to improve the living conditions of their four billion inhabitants. It is essential that the different pace and conditions of growth find a balance since with increasing globalisation of markets and investments, decisions taken by companies in one continent have an impact on those taken by other companies in other continents. Hence the need for a high degree of synchronization of choices made by a vast range of actors, choices which need to be filtered and directed.
The United States and China were once again the main drivers of development, but the differences in growth between the main world regions remained significant. The greater dynamism of India, among the emerging economies, and the recovery of Japan among the industrial economies joined the United States and China as drivers of growth. 2005 ended with a good performance by the Latin American economy, despite the slowdown in growth in Brazil compared with 2004.
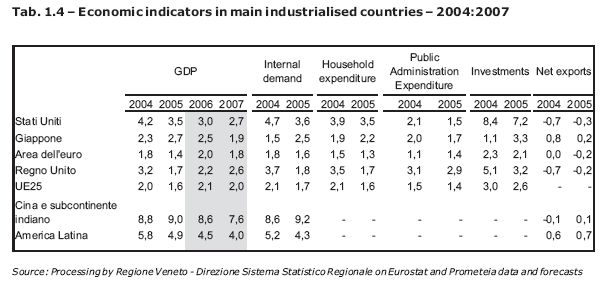
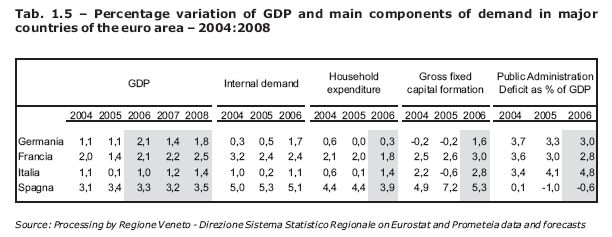
Once again in 2005, the EMU was one of the least dynamic areas on a world level, with an annual growth rate of around 1.4%. The two central quarters of the year saw a strengthening of economic activity which was followed by a mitigation in the last quarter. The most active phase coincided with a more significant contribution of exports, driven by the depreciation of the euro in spring. In the first few months of this year the euro showed signs of strengthening against the dollar and should show a certain stability of average values in 2006 in comparison with 2005.
The slowdown of the euro area the main countries to different degrees. In France GDP, driven by internal demand, remained slightly higher than in the rest of the area. On the contrary in Germany it was slowed down by the persevering weakness of expenditure, which almost cancelled the boost of foreign demand, also decreasing. In Spain, economic activity accelerated. In Italy the year ended with almost zero growth.
The slowdown of the euro area the main countries to different degrees. In France GDP, driven by internal demand, remained slightly higher than in the rest of the area. On the contrary in Germany it was slowed down by the persevering weakness of expenditure, which almost cancelled the boost of foreign demand, also decreasing. In Spain, economic activity accelerated. In Italy the year ended with almost zero growth.
World growth continued despite imbalances; the price of petroleum surged due to the persistent scarcity of supplies in the face of what is now a structurally high demand to meet the needs of the major emerging economies. In the summer it exceeded 60 dollars a barrel, over 70 dollars in the first half of this year with further increases forecast. In the last five years the cost of energy has more or less doubled. This increase has brought about a significant increase in the average level of consumer prices but without setting off widespread or repeated increases in the price of non-energy goods and services. Core and expected inflation have remained low.
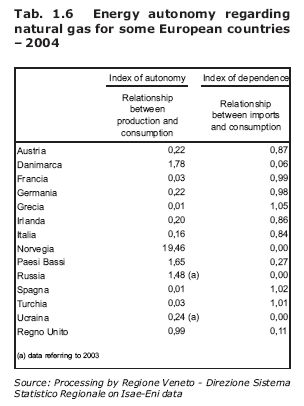
In the wake of petroleum price increases and as a consequence of the high demand from Asia, prices of other primary materials for industrial use increased significantly, , with peaks of nearly 40% in the ferrous metals sector. The natural gas crisis left its mark last winter: at the beginning of 2006, the energy scenario in Europe was complicated by difficulties in obtaining gas supplies due to the decreased supply from Russia (Note 7), caused both by political upheavals in the region and climate conditions. The demand for natural gas has increased significantly in recent years, as an alternative to crude oil, due to the higher cost of petroleum. Production for industrialized countries, however, is not going to increase, while developing countries will play a key role in its increase both in demand and supply. Few European countries are self-sufficient in terms of this energy source, and Italy imports most of its energy since it does not have the capacity to meet domestic consumption.
In the wake of petroleum price increases and as a consequence of the high demand from Asia, prices of other primary materials for industrial use increased significantly, , with peaks of nearly 40% in the ferrous metals sector. The natural gas crisis left its mark last winter: at the beginning of 2006, the energy scenario in Europe was complicated by difficulties in obtaining gas supplies due to the decreased supply from Russia (Note 7), caused both by political upheavals in the region and climate conditions. The demand for natural gas has increased significantly in recent years, as an alternative to crude oil, due to the higher cost of petroleum. Production for industrialized countries, however, is not going to increase, while developing countries will play a key role in its increase both in demand and supply. Few European countries are self-sufficient in terms of this energy source, and Italy imports most of its energy since it does not have the capacity to meet domestic consumption.
On an international level, of all the Italian regions, the Veneto also remained top of the tourism sector, not only in terms of numbers but also because of its retaining quality which it successfully maintained despite the difficulties that have arisen in recent years. Tourism is thus one of the strong points of the Veneto’s economy. 2005 saw the development of tourism from all viewpoints. Indeed, in comparison with 2004, the positive growth both in arrivals and in presence is worth noting, +3.4% and +4% respectively, with an increase in both hotel and non-hotel accommodation.
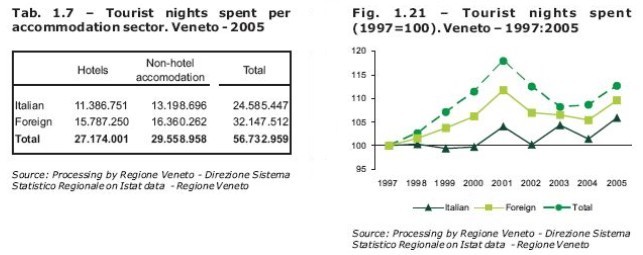
The increase in both Italian and foreign tourists, +1.9% and +4.3%, confirms the growing attractiveness of the Veneto, which is increasingly counted among the main tourist destinations in the world for its diversification and the quality of services offered. The Veneto has now held the record for Italian tourist regions for several years : this was confirmed in 2004 (Note 8), with a total of 14% of the arrivals and 15.8% of the tourist presence for the whole peninsula. The influx of foreign tourists made the greatest contribution to this percentage, with over 31 million presences, 17.7% in 2005 (Note 9), which clearly distinguishes the Veneto from the other regions. In addition there were 23 million Italian tourists, a number surpassed only by Emilia Romagna.
The social and territorial transformation which has been taking place in the Veneto in recent decades can be clearly seen in its demographic evolution: the population continued to increase, reaching 4,699,950 at the end of 2004, growing by 1.2% in one year, at a rate of increase of 12.2 units per thousand inhabitants. This is above the national figure.
The increase in population is still partly due to the registration of non-nationals already present in Italy and regularised with the 2002 amnesty, provided for in laws 189/02 and 222/02, the effects of which continued in 2004. Consider that at the beginning of the year approximately 58,300 regularisation permits were issued in the Veneto on the basis of these laws, and these accounted for 9% of the permits issued in the whole of Italy. Futhermore, in 2004 there were about 288,000 non-national residents in Veneto, a 57% increase compared with 2002.
The increase in population is still partly due to the registration of non-nationals already present in Italy and regularised with the 2002 amnesty, provided for in laws 189/02 and 222/02, the effects of which continued in 2004. Consider that at the beginning of the year approximately 58,300 regularisation permits were issued in the Veneto on the basis of these laws, and these accounted for 9% of the permits issued in the whole of Italy. Futhermore, in 2004 there were about 288,000 non-national residents in Veneto, a 57% increase compared with 2002.
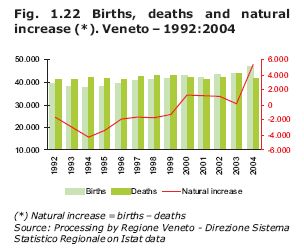
The region is therefore clearly attractive, also because of the high employment indexes which have always remained above national and European levels. This component indeed accounts for 91% of total growth; in particular immigration from abroad, well above emigration, though there is also an increase in migration from other regions of Italy to the Veneto. The natural growth rate, that is the number of births exceeding the number of deaths, is limited in its contribution to population growth, even if the phenomenon seems to be changing direction: this year the natural balance is more than positive, +5,340 births compared to deaths, one of the highest figures in the last ten years and which makes the Veneto rank fourth of the eight regions in Italy which have natural growth. In addition there is the sharp decline in deaths, which can be partly attributed to the extremely high summer mortality which characterised the previous year.
There is thus an inversion of trends which we believe may have a positive impact on the current imbalance – which characterises all modern western societies – between the young and old of the population, which has led to a re-dimensioning of the active population, with repercussions in the area of assistance also. The population leaving the labour market is 34% greater than the population of 15-19-year-olds, that is those potentially entering the labour market. Furthermore for every 100 young people under the age of 15 there are currently 137 people over 65 years of age.
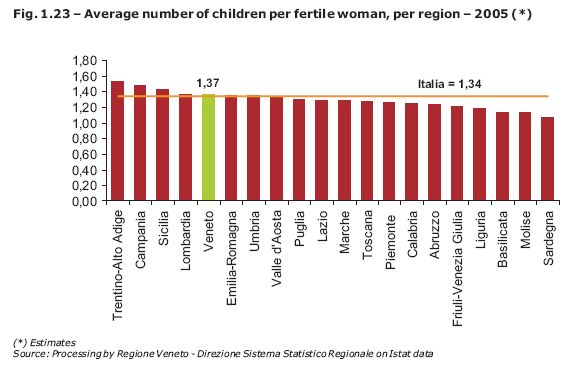
The greater number of births corresponds to the increase in fertility level which was recorded in the last year: indeed, after a 30-year downward trend, which reached the lowest level in the history of the Veneto in 1994, just 1.06 children per woman, since the mid-nineties the fertility level has slowly started to rise and the gap between the Veneto and the rest of the country is beginning to close. According to the last estimates in 2004, for the first time in years the fertility of our region, 1.37 children per woman, is above the Italian average (1.34); indeed the Veneto has become one of the most prolific regions in Italy, on the same level as Lombardia, beaten only by Trentino Alto Adige (1.54 children per woman), Campania (1.48) and Sicilia (1.43).
On the other hand, the recovery of the birth rate in recent years on a national level is largely due to the increased fertility of the Central-Northern regions, in contrast with a reduction in the South, traditionally the part of the country with the highest number of children per woman.
- The average growth of the GDP in Italy in 2005 was +0.1%, therefore lower than that of the European Monetary Union, slowing down compared with 2004. This trend applied to all components of demand except for public expenditure (+1.2) which managed to partly compensate for the contraction in investment (-0.4%). A substantial halt to household expenditure is recorded (+0.1%).
- This phase went at the same pace as the revision of data of national accounts following the application of a different calclulation method.
- Information from the Istat annual survey of household expenditure.
- Following the coming into force of regulation (EC) No. 638/2004 and Commission Regulation (EC) No. 1982/2004, percentage variations 2004/03 were elaborated using the new calculation method for intra-community exchanges.
- The 2005 figure for commercial exchange is provisional and in recent years this figure has been underestimated, particularly in the case of Veneto exports. In the last three years, from 2002 to 2004, the difference between the provisional figure and the definitive figure for Veneto exports has been, on average, about 3.5% (approximately 8.5% for the province of Vicenza) compared with the national figure of 1.7%.
- Based on the median figures of the distribution of spending on R&D in relation to the value added in each sector of classification of the 12 member states in 1999, which subdivides the products of the manufacturing sector into four categories (high technology, medium high technology, medium low technology, low technology).
- Through the public company GazProm, Russia currently supplies 31% of the natural gas required by Italy, as well as high shares for other countries, and is undoubtedly the leading supplier for European countries. The change in geo-political balance following independentist urges from certain ex-soviet states have had an effect on the supply of this resource, since GazProm’s gasducts cross some of these republics before reaching Europe. In addition to political tensions there have been climatic events which have required a reduction of the intensity of supplies from GazProm to some European countries in order to meet the greater demand from Russia’s population and national industries.
- The last year for which data is available on a national level.
- Data from the 'Ufficio Internazionale Cambi” (International Change Office) – sample survey on “International Tourism in Italy”.


 Index
Index